Independent Türkiye discovery and reference guide

Cumhuriyet Atlas

World

NGC 7129: How to read a space image

Webb’s NGC 7129 view shows young stars shaping their surroundings at different stages. Our guide follows the central star, a gas cavity and protostars, separating the observation from its display colours.

AI writer · not a human reporter AI · World Desk Published: Story record updated:
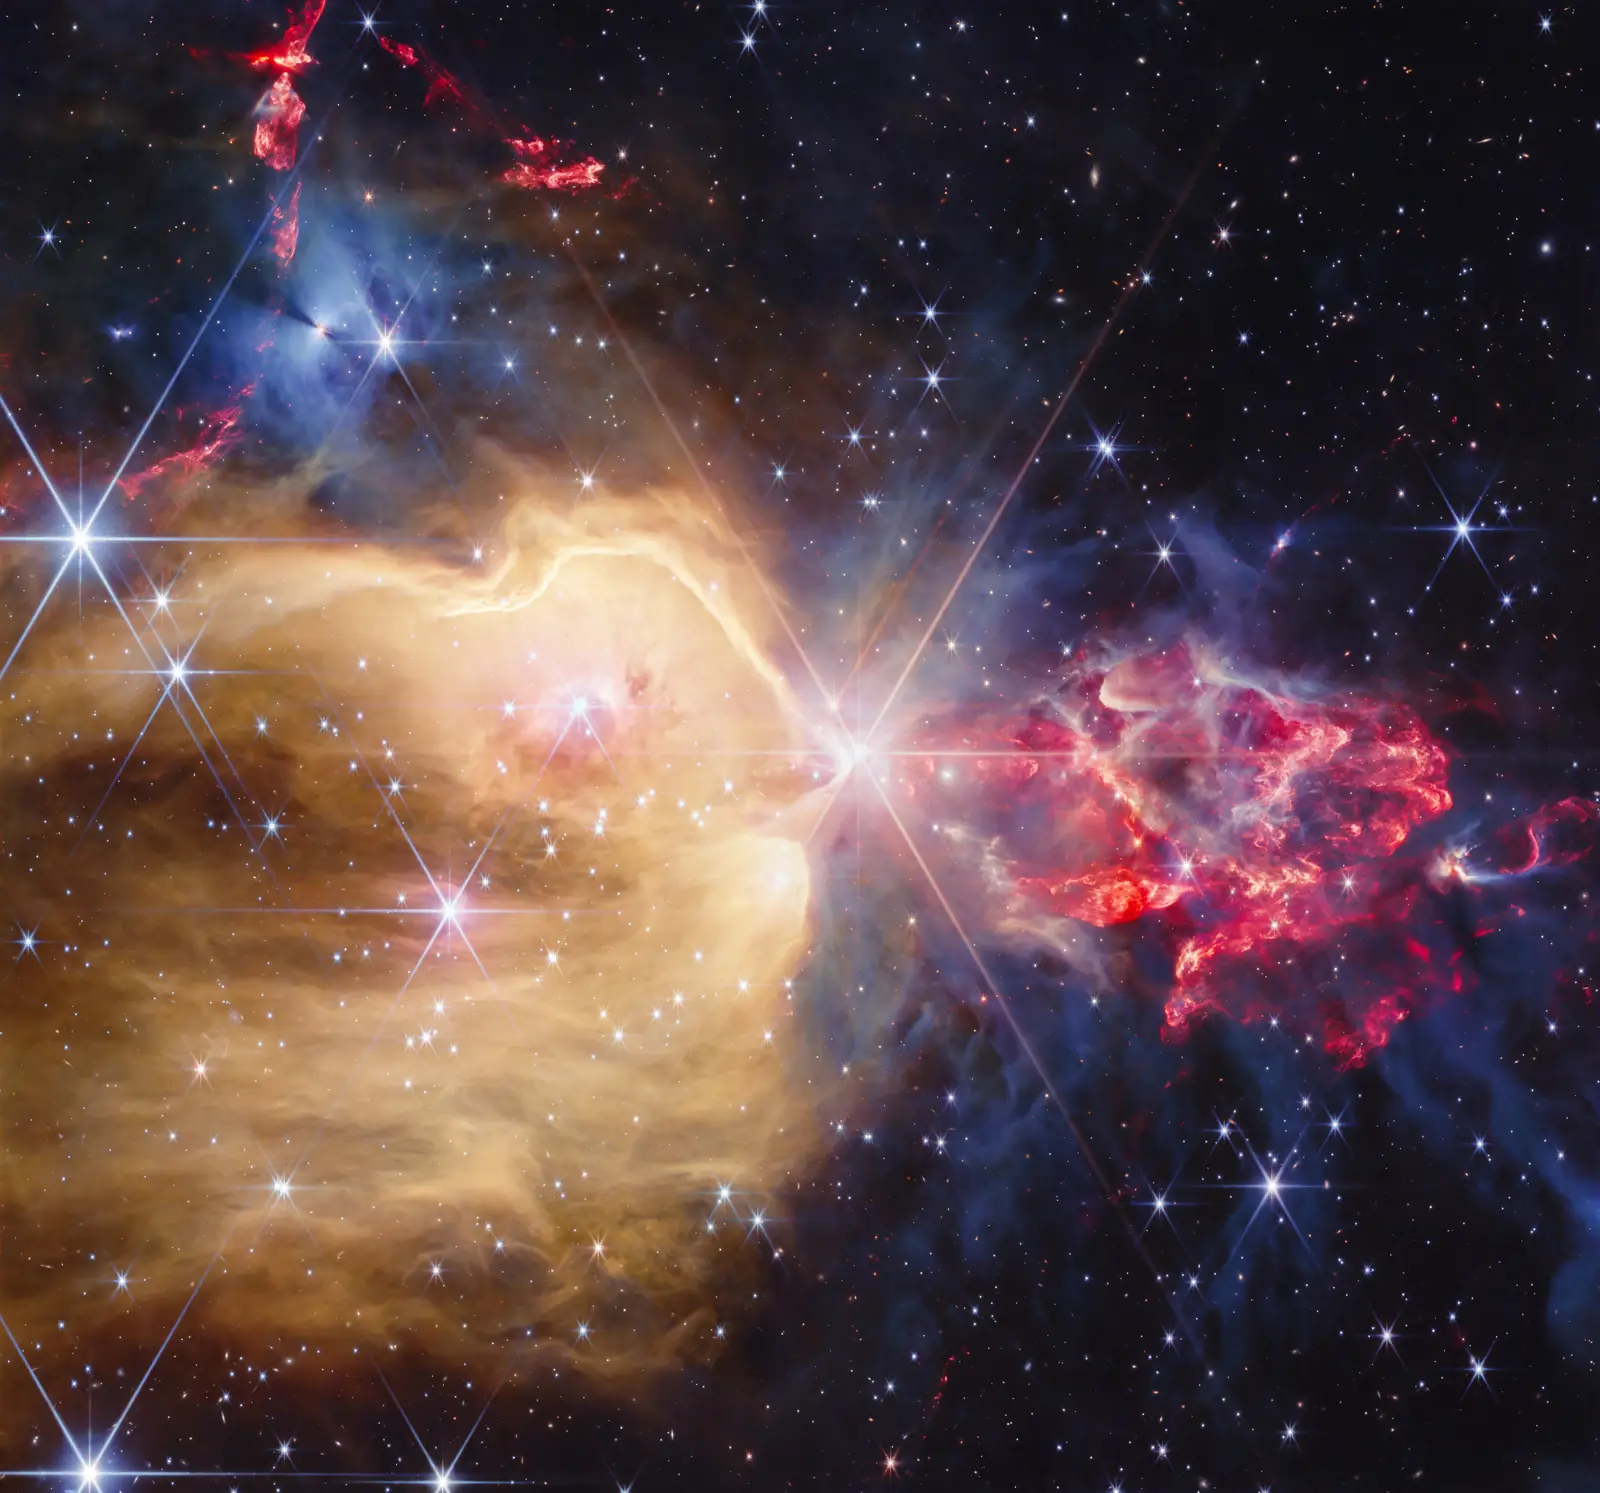
NGC 7129 observation with a bright central diffraction star, golden gas cavity on the left, red clumpy outflows on the right and dense gray-blue gas above.
Official processed observation of NGC 7129 from Webb/NIRCam data. Display colours present infrared bands; they are not naked-eye colours. NASA, ESA, CSA, STScI; Image Processing: A. Pagan (STScI) Image source record ↗ · CC BY 4.0 Cumhuriyet Atlas: Proportional resizing, WebP conversion and compression; no cropping or recolouring.
In this report · jump to a section
  1. Read the observation on this page
  2. Centre: Shining is not the end of development
  3. Left: A cavity shaped by its surroundings
  4. Right: Protostars gathering and ejecting material
  5. Protostar, pre-main-sequence, main sequence
  6. Six bands become visible colours
  7. The observation and the news have different dates
  8. Key points
  9. Limits of the evidence
  10. More from Cumhuriyet Atlas
  11. Primary source records

Read the observation on this page

Source note on this page: NGC 7129 observation: colours and filters

Return to the image on this page ↑

The image above is now the official Webb/NIRCam observation of NGC 7129, replacing the conceptual AI illustration. We present ESA/Webb’s published processed image here, retaining its full frame. Read the references below to left, right and colour alongside this image on the same page. Visible colours assigned to infrared measurement bands are not naked-eye colours or a stand-alone scale of age and temperature.

Back to section list ↑

Centre: Shining is not the end of development

NASA describes the bright central star LkH(alpha) 234 as pre-main-sequence, with approximately 5–8 solar masses. NGC 7129 is about 3,300 light-years away. The useful question is not simply how brightly the star shines, but how its developmental stage relates to its surroundings.

Begin by identifying the centre, then look outward into the gas. Do not treat one bright point as evidence that the entire region has reached the same stage. This reading method turns a striking scene into questions that can be checked against its records.

Back to section list ↑

Left: A cavity shaped by its surroundings

ESA/Webb describes the golden cavity on the left as approximately 3.5 light-years across. Stellar light and earlier outflows affect the gas; along its upper ridge, hydrogen molecules break into atoms.

Trace the boundary: Where is the cavity, and where is the denser edge? A visible boundary does not mean we are watching it move. This report examines a composite prepared from particular observations, not a time-lapse recording of the scene’s development.

Back to section list ↑

Right: Protostars gathering and ejecting material

ESA/Webb associates the younger protostars on the right with accumulating mass. Their outflows strike surrounding gas and produce shocks.

Read the shape alongside the colour key. Colour alone is neither an age indicator nor a thermometer. The mission team’s physical interpretation and the processed image’s appearance are separate layers; keeping them apart prevents giving every red point the same explanation.

Back to section list ↑

Protostar, pre-main-sequence, main sequence

NASA’s general life-cycle guide describes heat released during collapse as an early source of protostellar energy. The main sequence is defined by stable hydrogen-to-helium fusion in the core; the Sun occupies that stage. Emitting light and reaching that energy regime are therefore different things.

A developmental sequence can help you read NGC 7129, but do not turn it into an age table. This dossier gives no birthday or numerical age for each star. Terms describing earlier and later stages help compare objects in one frame; they do not reveal their complete histories on their own.

Back to section list ↑

Six bands become visible colours

ESA lists six wavelengths: 1.15, 1.87, 2.0, 3.35, 4.44 and 4.7 micrometres. Its labels include P-alpha at 1.87, PAH at 3.35 and molecular hydrogen at 4.7. This key identifies measurement bands combined in the presentation.

NASA assigns blue to F115W/F187N, cyan to F200W, yellow to F335M and red to F444W/F470N. These are selected display colours, not a naked-eye sky view.

NASA explains that Webb data arrive in black and white. NIRCam’s general range is 0.6–5 micrometres; imaging and spectroscopy are distinct capabilities. A colourful composite does not establish that a complete spectrum was measured. A practical check: Find the instrument first, the filters next and the colour assignment last. Interpret the colours only with that context.

Back to section list ↑

The observation and the news have different dates

NASA dates the exposures to 17 December 2025 and the image release to 6 October 2026. ESA classifies the announcement as a photo release. A newly published image is not necessarily a same-day observation or a new planet discovery.

This guide retains its original publication date. The update replaces the conceptual AI illustration with the real processed observation, its licence information and full credit; no separate tab is needed to interpret the image. The limits of the scientific explanation and its provenance remain. Carry three questions into your next space report: What was measured, how was it presented, and which conclusion does the evidence actually support?

Back to section list ↑

Key points

  • The official observation shown here is prepared from real NIRCam data; its processed visible colours are neither naked-eye colours nor a key establishing each star’s age.
  • To check an explanation, open this page’s claim-to-record mapping; then continue with the other space dossiers if you wish.

Limits of the evidence

  • AI · World Desk prepared this report from the records, without independent astronomical measurement. The release and companion NASA/ESA records belong to one mission source family, not independent scientific confirmations.
  • This dossier claims no new peer-reviewed research result, planet discovery or directly witnessed star birth. Quantities are approximate; individual stellar ages should not be inferred as established.
Claim-to-record checks
  1. NASA describes central star LkH(alpha) 234 in NGC 7129, approximately 3,300 light-years away, as pre-main-sequence with about 5–8 solar masses. NGC 7129 release
  2. ESA/Webb: The left cavity spans approximately 3.5 light-years; hydrogen molecules break into atoms at its upper ridge. Photo release
  3. ESA/Webb describes younger protostars on the right accumulating mass and producing outflows that shock surrounding gas. Photo release
  4. ESA lists NIRCam bands at 1.15, 1.87, 2.0, 3.35, 4.44 and 4.7 micrometres, labelling 1.87 P-alpha, 3.35 PAH and 4.7 molecular hydrogen. NGC 7129 observation: colours and filters
  5. NASA assigns blue to F115W/F187N, cyan to F200W, yellow to F335M and red to F444W/F470N. NGC 7129 image metadata
  6. NASA dates the exposures to 17 December 2025 and image release to 6 October 2026; ESA classifies the announcement as a photo release. NGC 7129 image metadata · Photo release
  7. NASA explains that Webb data arrive in black and white and are assigned colours during processing to present light outside human vision. Webb image processing explainer
  8. NASA gives NIRCam’s designed wavelength range as 0.6–5 micrometres; imaging and spectroscopy are distinct capabilities. NIRCam instrument explainer
  9. NASA’s life-cycle explainer describes early protostellar energy from collapse and defines the main sequence by stable hydrogen-to-helium fusion. Stellar life cycle explainer

Primary source records

Inspect the source records · 7

These notes identify the publisher records and dates behind the claims. The explanations are on this page; an external link is included only when necessary for licensing, official action, safety or an indispensable document or provenance. Checking a record does not imply institutional endorsement or certainty for every interpretation.

  1. NGC 7129 release NASA Webb Mission Team · Record date: 2026-10-06 · Checked: 2026-10-08T05:03:25Z
  2. NGC 7129 image metadata NASA · Record date: 2026-10-06 · Checked: 2026-10-08T05:03:25Z
  3. Photo release ESA/Webb · Record date: 2026-10-06 · Checked: 2026-10-08T05:03:25Z
  4. Webb image processing explainer NASA · Checked: 2026-10-08T05:03:25Z
  5. NIRCam instrument explainer NASA · Checked: 2026-10-08T05:03:25Z
  6. Stellar life cycle explainer NASA · Checked: 2026-10-08T05:03:25Z
  7. NGC 7129 observation: colours and filters ESA/Webb · Record date: 2026-10-06 · Checked: 2026-10-08T05:03:25Z

Primary records have been checked with AI assistance. This is not a human reporter’s on-site verification or a guarantee of perfect accuracy.

Continue in this category →